

Prevent Stockouts: Reorder Point for Tickets That Exposes Lead Time

Your reorder point for tickets is: (average daily unit sales × lead time in days) + safety stock. When on-hand inventory drops to that number, you place the replenishment order or let your automated trigger fire. Make sure sales velocity and lead time use the same time unit (days to days), or the math falls apart before you even start.
TL;DR:
- Maintaining accurate lead time measurements, including internal processing delays, is crucial for setting correct reorder points for tickets.
- Using the max-min safety stock method ensures a quick and realistic buffer based on historical worst-case demand and supply delays.
- Regularly reviewing and updating reorder points at least quarterly helps adapt to demand shifts, supplier lead-time changes, and seasonal fluctuations.
- Managing on-hand and on-order quantities against the ROP prevents double-ordering and stockouts during high-demand events or season peaks.
- Working with suppliers who offer shorter, consistent lead times reduces the need for large safety stocks and improves reorder reliability.
Table of Contents
- What Reorder Point Means for Ticket Inventory
- The ROP Formula, Variable by Variable
- Calculating Your Reorder Point Step by Step
- Safety Stock Methods That Actually Fit Ticket Operations
- Measuring Lead Time for Custom-Printed Tickets
- Setting Up ROP Tracking: Spreadsheets, Software, and Order Rules
- How Often to Review Your Reorder Points
- An Inventory Manager’s View on Reorder Discipline
- A Shorter Lead Time Beats a Bigger Safety Stock
- Sources
- FAQ
What Reorder Point Means for Ticket Inventory
Reorder point (ROP) is the specific stock level that tells you it’s time to order more before you run out. For consumable ticket media like valet roll stock, sequentially numbered event blocks, or permit decals, that threshold carries more weight than it does for a typical retail SKU. Tickets are transactional. Run out mid-shift and you don’t just lose a sale. You stop the operation.
A stockout on valet tickets means attendants improvising with handwritten claim slips, which frustrates customers and creates reconciliation headaches at shift’s end. A stockout on a barcoded parking ticket used for revenue tracking can mean lost audit data for however many vehicles cycle through before the next batch arrives. On the other side, overstocking has its own cost. Dated event tickets or a custom print run tied to a permit cycle that ends up sitting in a stockroom becomes dead inventory the moment the season or the contract changes.
ROP works best for tickets because usage tends to be fairly predictable within a given operation, even when volume varies by day of week or event calendar. It’s the right tool when:
- Demand has a discoverable pattern (daily averages, weekly cycles, known event spikes)
- Lead time from your supplier is measurable and reasonably consistent
- The cost of stopping out (lost revenue, customer friction, compliance gaps) outweighs the cost of carrying a modest buffer
Where ROP struggles is in genuinely one-off situations, like a brand-new venue with zero sales history. There, you’re better off estimating conservatively for the first cycle, then switching to a real ROP model once you have a few weeks of data.
The ROP Formula, Variable by Variable
The standard industry formula for a reorder point is straightforward:
ROP = (Average Daily Unit Sales × Lead Time in Days) + Safety Stock

Getting a usable number out of that formula depends entirely on how carefully you define each input.
Average daily unit sales is total units used over a period, divided by the number of days in that period. If a garage cycles through 1,400 valet tickets over a 28-day month, average daily usage is 50 tickets. Pick a window long enough to smooth out weekday noise. Two to four weeks usually works for steady operations; three to six months is better if your business has a strong seasonal pattern.
Lead time is the full number of days between placing your order and having usable stock in hand, expressed in whole days so it lines up with your daily sales figure. This is where most ticket operators underestimate. Lead time isn’t just “shipping time.” It includes your own internal processing lag before the order even goes out.
Safety stock is the buffer that covers the gap between what you expect to happen and what actually happens. It exists to absorb late deliveries, sales spikes, or both at once. As one breakdown of the formula notes, safety stock is a deliberate, calculated cushion, not just leftover inventory sitting around out of habit. It’s worth building into the calculation rather than skipping, especially for ticket types tied to specific dated events where a late shipment has no workaround.
Calculating Your Reorder Point Step by Step
Here’s how to run the numbers for two real scenarios: a garage reordering standard barcoded tickets, and an event venue waiting on a custom print run.
-
Pick your historical window and calculate average daily sales. For the garage example, pull the last 60 days of ticket usage from your access-control system or manual logs. Say usage totals 3,000 tickets. That’s 50 tickets per day on average.
-
Measure true lead time from purchase order to usable stock. Look at your last five to ten reorders. Note the date you submitted the PO and the date tickets were actually loaded into the dispenser or shelved. If your average comes out to 7 days, that’s your lead time. If your worst case was 12 days because of a shipping delay, keep that figure too. You’ll need both.
-
Calculate safety stock using the max-min method. One simple, workable formula is: (maximum daily sales × maximum lead time) − (average daily sales × average lead time). If max daily sales hit 70 and max lead time was 12 days, that’s 840. Average daily sales (50) times average lead time (7) is 350. Safety stock = 840 − 350 = 490 tickets.
-
Finalize the ROP. (50 × 7) + 490 = 840 tickets. When your on-hand count reaches 840, order more.
Reorder point: 840 tickets triggers the next order for this garage, based on 50 tickets/day average usage, 7 days average lead time, and a 490 ticket safety buffer built from worst-case demand and delay.
Now the harder case: a custom-printed sequential event ticket with a 21 day average lead time and a 35 day worst case, because of proofing rounds. If average daily sales during the event lead up are 30 tickets, your baseline is 30 × 21 = 630. Safety stock, using the same max-min approach with a peak daily rate of 60, comes to (60 × 35) − (30 × 21) = 1,470. Total ROP: 2,100 tickets. That’s a dramatically bigger buffer than the garage example, purely because custom lead time and its variance are both larger. Before you place any order, check on-hand stock plus anything already on order against your ROP. Skipping that on-order check is how operators end up double-ordering.

Safety Stock Methods That Actually Fit Ticket Operations
The max-min method covers most parking and valet operations well because it’s fast to calculate and doesn’t require statistical software. Take your worst observed daily sales and worst observed lead time, multiply them, then subtract the average-case multiplication. The result is a buffer sized to your actual historical worst case, not a guess.
For operations with enough sales history and some analytics comfort, a probabilistic method using standard deviation and a service-level z-score gives a more statistically grounded buffer. It’s overkill for a single-location valet stand but worth it for a multi-site parking management company running dozens of SKUs.
If you’d rather skip formulas entirely for low-stakes items, a rule-of-thumb works fine: keep 5 to 10 days of average coverage as safety stock for standard stock tickets, and closer to 15 to 20 days for anything custom-printed.
- Max-min method: fast, no statistics background needed, good for single-location operators
- Std-dev + z-score method: more accurate, better for high-volume or multi-site operations with clean sales data
- Days-of-coverage rule of thumb: quick estimate for lower-priority SKUs
Pro Tip: Before a major local event, run a small test: bump safety stock on just the SKUs tied to that event, then check afterward how much of that extra buffer actually got used. That tells you whether to repeat the uplift next time or scale it back.
Measuring Lead Time for Custom-Printed Tickets
Custom ticket runs, whether sequentially numbered valet stock, barcoded parking tickets, or multi-part carbonless forms, carry lead-time components that a simple “order to delivery” number misses entirely. Internal processing delays are one of the most common causes of an underestimated lead time, and they compound fast on custom orders.
To get a true end-to-end figure, track each stage separately using your PO history and internal timestamps:
- Time from request to proof approval (this alone can run several days if multiple stakeholders sign off)
- Plate or press setup time, which varies with the complexity of security features or custom colors
- Quality control and inspection before tickets ship
- Receiving, unboxing, and data entry once tickets arrive at your facility
Barcoded and sequentially numbered tickets add QC steps because someone has to verify number ranges don’t overlap or skip. Multi-part carbonless formats add press setup time on top of that. Once you’ve logged these stages separately for a few orders, average them into one true lead-time figure, and use the longest observed total as your worst-case input for safety stock. Reducing lead time itself, by locking proofs faster or keeping a pre-approved template on file, is usually cheaper than carrying extra inventory to compensate for it.
Setting Up ROP Tracking: Spreadsheets, Software, and Order Rules
A spreadsheet works fine for a single garage or valet stand. Set up columns for SKU name, average daily sales, lead time in days, safety stock, on-hand quantity, on-order quantity, and a calculated ROP column using the formula directly: =(AvgDailySales*LeadTimeDays)+SafetyStock. Add a conditional flag that highlights any row where on-hand plus on-order drops to or below the ROP value.
- Build one row per SKU with the columns above, and recalculate ROP whenever you update sales or lead-time data.
- If you’re managing more than a handful of SKUs across multiple locations, move to inventory management software that automatically checks on-hand plus on-order against ROP and flags reorders. Many platforms include built-in reorder point calculators so you’re not doing this arithmetic manually across dozens of ticket types.
- Pair ROP with a reorder quantity rule rather than guessing how much to order each time. Economic order quantity (EOQ) balances ordering costs against carrying costs; a simpler fixed-multiple rule (always order enough for 30 days of average usage, for example) works fine for most ticket operators.
- Build in a manual review step for any order above a dollar threshold, and check for duplicate open POs before submitting a new one. This single safeguard prevents the most common and expensive ROP mistake: ordering twice because nobody checked what was already inbound.
How Often to Review Your Reorder Points
ROP isn’t a set-it-and-forget-it number. Regular audits keep it aligned with actual conditions, and ticket demand shifts more than most physical inventory because it’s tied to events and seasons.
Run a full audit quarterly at minimum. Outside that schedule, review immediately when any of these happen:
- A supplier’s lead time changes, even by a few days
- A large local event or seasonal spike is coming up on the calendar
- You’ve had two or more stockouts on the same SKU in a short window
For a quick quarterly check, recalculate ROP for your five highest-volume or highest-value ticket SKUs, and compare your expected lead-time demand against what actually happened last cycle. If the gap is wide, your inputs are stale.
An Inventory Manager’s View on Reorder Discipline
Operators who stop treating ROP as a one-time setup and start tracking it weekly report fewer panic orders and rush shipping fees. A garage that logged real lead times instead of guessing avoided a stockout during a stadium event weekend that would have shut down two entry lanes. Small habit changes, checking on-order quantities before reordering and revisiting ROP after any supplier delay, do more than any fancy formula. Pair your reorder points with a clear lead-time agreement from your supplier, and most emergency orders disappear.
— Richard
A Shorter Lead Time Beats a Bigger Safety Stock
Building a bigger safety stock buffer is the fallback when lead time is long and unpredictable. Working with a supplier that keeps lead time short and consistent solves the problem closer to the source, and it’s usually cheaper than carrying extra inventory month after month.
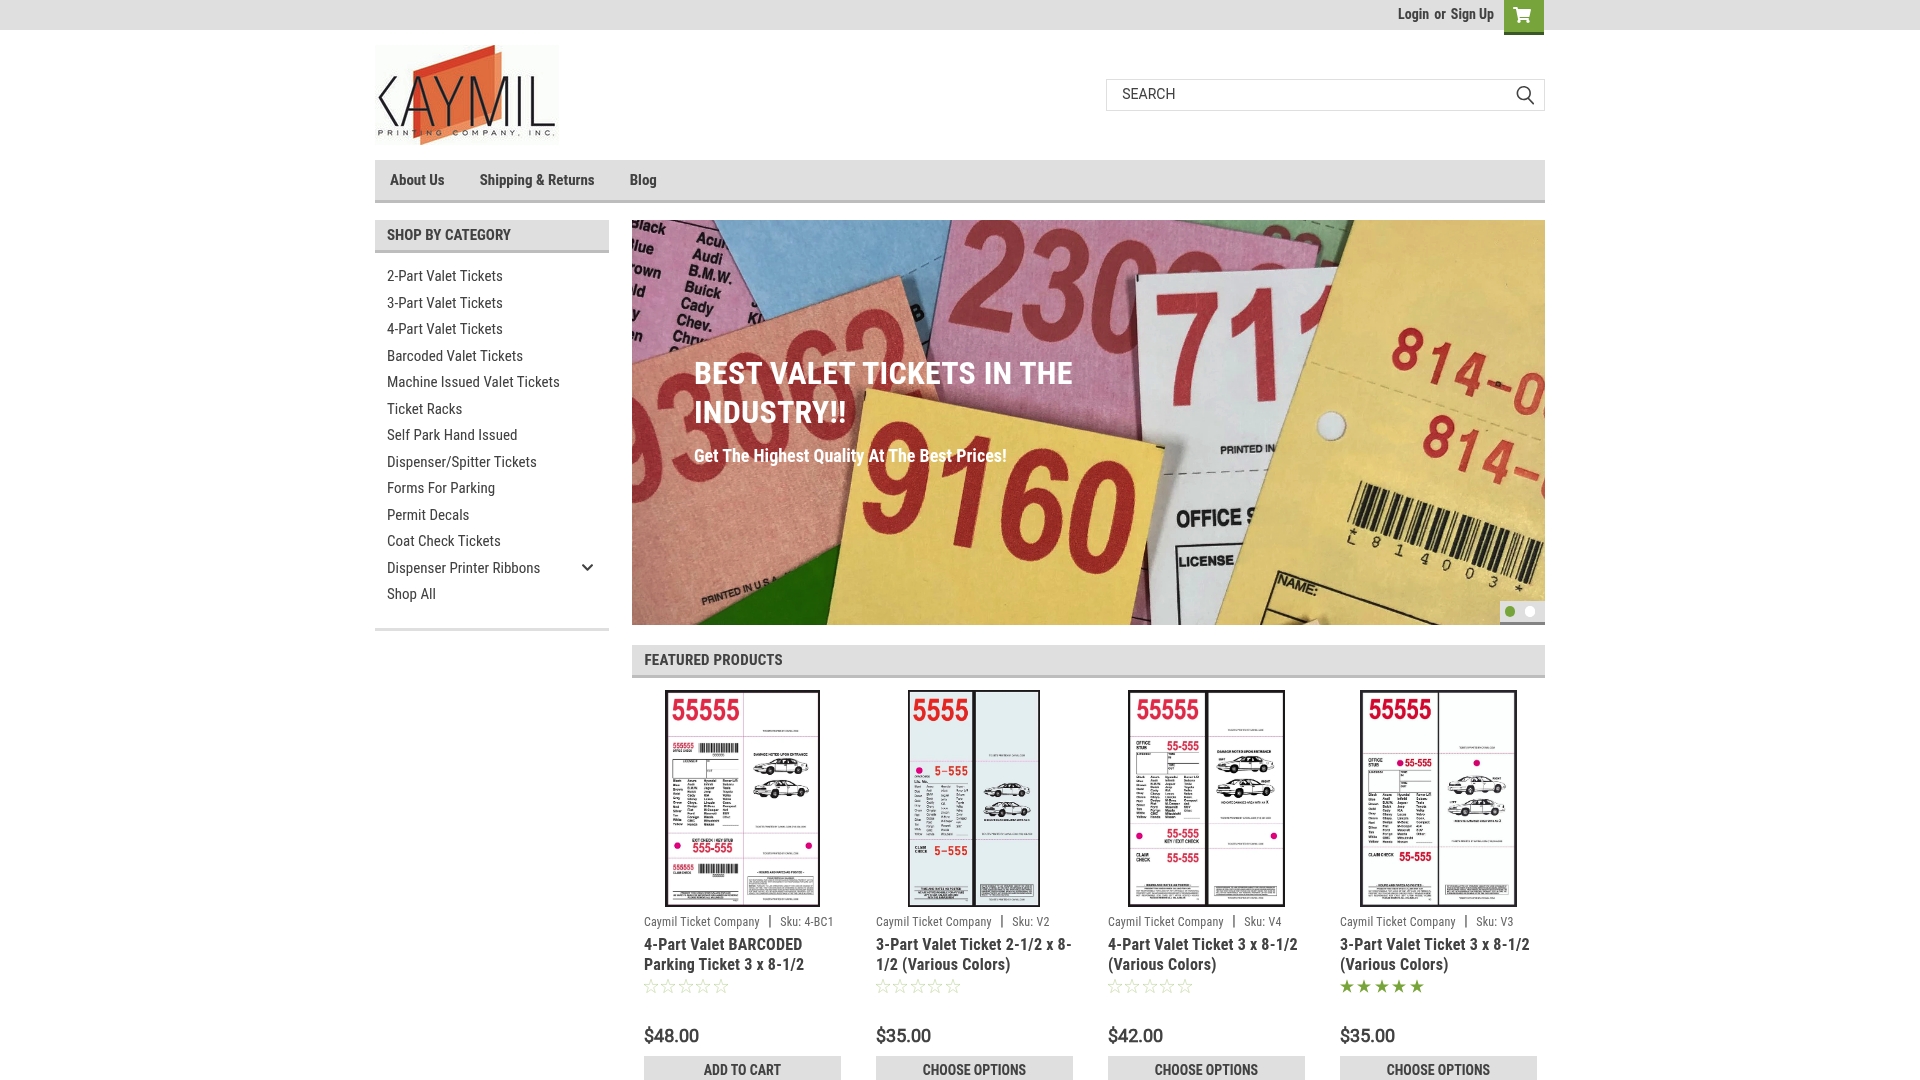
Caymil has manufactured valet, parking, and event ticket media since 1937, with millions of tickets in stock and options for sequential numbering, barcoding, and multi-part carbonless formats compatible with major parking systems. For operators reordering standard valet parking tickets or machine-issued tickets for dispenser printers, stock availability means shorter, more predictable lead times, which lowers the safety stock you need to carry. If you’re setting up your ROP spreadsheet now and want a reliable lead-time figure to plug in, browse Caymil’s forms for parking and request a quote based on your actual monthly volume.
Sources
FAQ
How do I calculate the reorder point for tickets?
Multiply your average daily ticket sales by lead time in days, then add safety stock: ROP = (average daily unit sales × lead time) + safety stock. Order more stock as soon as on-hand plus on-order inventory reaches that number.
What is EOQ and how does it relate to ROP?
Economic order quantity (EOQ) tells you how many tickets to order each time to balance ordering costs against carrying costs, while ROP tells you when to place that order. The two work together: ROP triggers the order, EOQ sizes it.
What is meant by reorder point?
A reorder point is the specific inventory level that signals it’s time to reorder before you run out of stock. For tickets, it accounts for both how fast you use them and how long a new supply takes to arrive.
How do I calculate ROP without a lot of sales history?
Estimate conservatively using a short window of available data, lean toward a larger safety stock margin, then recalculate with real numbers after a full sales cycle. A supplier that keeps common ticket formats in stock can also reduce the risk while you build that history.